Adding or Changing a Symbol to a Single Symbol Widget

When adding a new chart or HOT widget, the last seelected symbol will be used to populate the chart or HOT.

Changing a Symbol

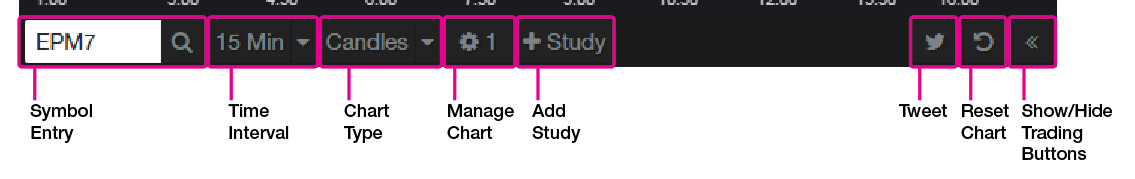
Once you have a widget on the page, you can change the symbol using the entry field in the toolbar. You can search for an exchange symbol, a name of a commodity, or a CQG symbol in the entry field. Use the arrow keys or click one of the results in the list.

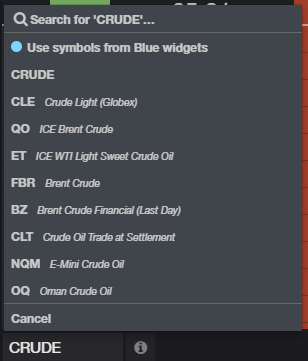
Easily change a symbol when a widget is in focus

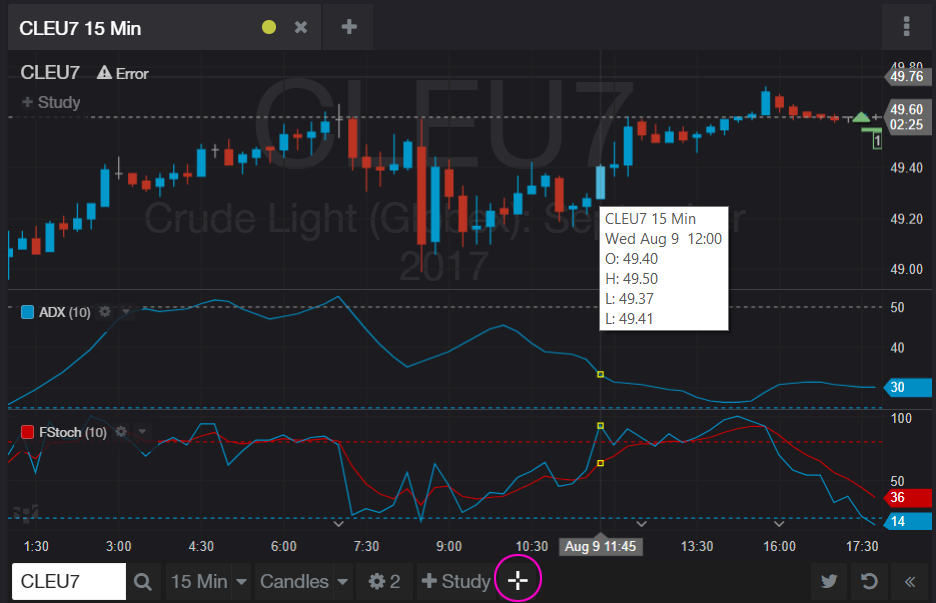
Easily change symbols in single-symbol widgets by simply typing when the widget you want to change is in focus (highlighted with blue tab). You no longer have to click in the symbol entry field to enter a symbol or to use autosuggest.

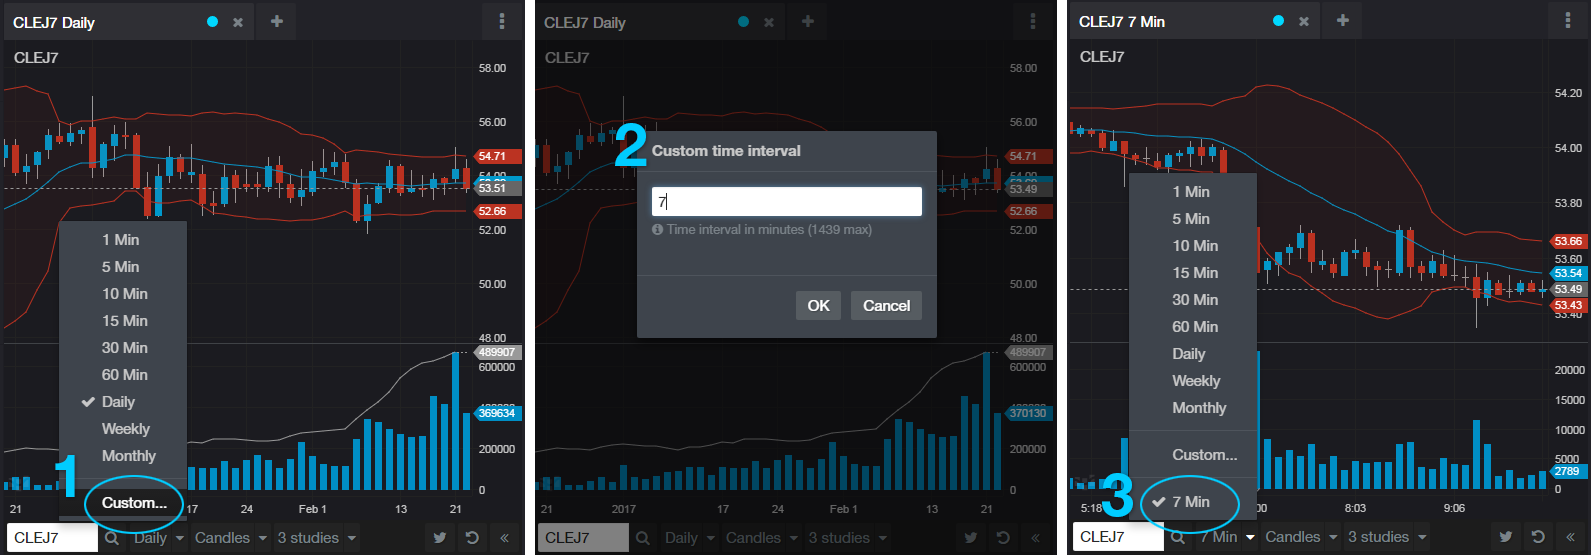
In addition, easily change chart interval by typing "," + interval abbreviation and enter any interval. For example, ",1" will change the selected chart to a 1 min chart, ",d" for daily, etc.
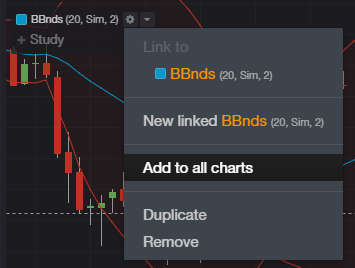
Linking Windows

If linking is on in any other widgets, you will see the link group color show up in the list. If you already have a quote board with linking turned on, and you're planning on pushing symbols to this widget, you can select the link color instead of entering a symbol. You can enable linking at any time in the tabs.

Chart Basics

Panning

  • Dragging to the background of the chart to the right will pan back in time.

Zooming

  • Dragging down on price (right bar) will shrink the chart vertically, dragging up will increase vertically.
  • Dragging to the right on the time scale (bottom bar) will compress bars, dragging to the left will expand bars.
  • Double tap (on the phone), or double-click (in a desktop browser) the background of the chart to reset the chart to default sizing and spacing.

Auto-scale

  • Auto-scale mode: compressing and expanding the price scale as well as dragging the chart vertically where bars are out of view takes the chart out of auto-scale mode. Double-clicking on the chart background will return the chart to Auto-scale mode.
  • Auto-scale with studies: disregards studies and only keeps chart bars when panning the chart.
  • Auto-scale without studies (blue): keeps chart bars and studies when panning the chart.

CQGDesktop-chart-autoscale

Chart Toolbar

Chart toolbar

Crosshair mode, Tooltips, and Cursor Value

  • To help highlight objects beneath your cursor on hover, enable crosshair mode by using the button in the toolbar.
  • Hover over a bar or study to get a tooltip of the underlying data from that bar or study.

Crosshairs and tooltips

When rolling over the chart when crosshairs mode is 'on', the chart will display cursor values for the chart bars and studies.

3-02-chart-cursor-01

Add a Study

  • Add a study using the +Study button in the chart toolbar or at the top left-hand corner of the chart.
  • The dialog to manage charts will open with the +Study tab selected.
  • Type in the entry field to filter available studies.
  • Select a study and hit the Add or Add + Close button.
  • Recently used studies are easily accessed in their own section.
  • Use the Add button when you want to add multiple studies, use the Add + Close button or the X in the upper right-hand corner when finished.

Add Study

Managing Objects on the Chart

The reason for the On chart dialog is to have a single dialog where you can see everything that is visible on a chart and add, remove, and manage studies instead of having to go to five different right-click or preference entry points.

  • To add/remove studies or show/hide objects on the chart, click the gear icon in the chart toolbar.
  • A number appearing beside the gear indicates how many studies are shown on the chart.

The Object section in this dialog contains toggles for managing different chart features like daily and cursor values, thermometers, symbol watermark, thermometers, orders, countdown timers and session lines.

Manage Chart

Remove a Study

  • Remove a study by using the drop-down next to the study name either in the On chart dialog or on the left side of the chart.

Auto-scale with studies on chart

A new toggle button switches between auto-scaling with or without studies when panning the chart.

Countdown to End of Bar

  • Open the Manage Chart dialog from the gear icon in the chart toolbar.
  • Check the Bar countdown (intraday) option in the Objects list.
  • A countdown timer will appear below the last price in the price scale.

2_13_chart_barcountdown

More about Studies

Study Parameters

  • Access the Parameters dialog using the gear icon beside any study name, on the chart, or in the Manage Chart dialog.
  • Changes are shown immediately on the chart.

Study Parameters

Study Visual Style

  • Access the Style tab of the Chart parameters dialog using the color swatch icon next to any study name.
  • Changes are shown immediately on the chart.

Study Style

Study Menu

Access additional tasks for a study using the drop-down next to any study name.

Add a study to all charts on a page by selecting Add to all charts.

Add a study to all charts

Linked Studies

This a new feature designed to minimize the amount of study parameter tweaking that is done across different time intervals or symbols. By using a linked study, every change to parameter or style is immediately updated on every chart using that linked study.

You can have multiple linked studies.

Pointer & Drawing tools

Horizontal and Vertical Line Pointer Tools

Horizontal and vertical line pointer tools (cursors) have been added to the chart. This video will show you the various ways to add and interact with them.

Adding a horizontal line

  • A pointer tool toolbar has been added to the far right of the app. This is a global toolbar for all charts on the page.
  • Click on the line icon. 
  • Once the tool is highlighted, clicking on the chart will place a cursor.
  • When a cursor is selected, three white circles will appear on it.
  • Use these white circles to drag the line.

Place a horizontal line to select a price in the trading toolbar

  • When the trading toolbar is open, clicking in the price scale to place a horizontal line will push that price to the trading toolbar.

Global cursors on charts

From the pointer tools toolbar, click the link icon beneath the Cursor pointer tool. This will activate crosshairs on all charts.


Drawing Tools: Trend Lines

Adding a trend line

  • A pointer tool toolbar has been added to the far right of the app. This is a global toolbar for all charts on the page.
  • Click on the line icon.
  • Once the tool is highlighted, click on the chart to place the first point, then click again to place the second point to create a line.

Adding a trend channel

  • A pointer tool toolbar has been added to the far right of the app. This is a global toolbar for all charts on the page.
  • Click on the line icon.
  • Once the tool is highlighted, click on the chart to place the first point, then click again to place the second point to create a line.
  • The channel line will appear immediately after placing the second point. Move your mouse to create the channel. Click to place the channel.

Changing drawing tool and line properties

  • Whenever a drawing or a drawing tool button in the toolbar is selected, a floating toolbar will appear.
  • You can drag this toolbar to wherever you'd like. There is one floating palette for the entire app.
  • Use the buttons on the toolbar to edit the properties of a selected cursor.

Editing and deleting drawing tools and lines

  • When a drawing is selected, three white circles will appear on it.
  • Use the white circles to drag the drawing to another location.
  • Delete a drawing by right-clicking on one of the white circles.

Accessing pointer tools when there are several versions of similar tools

When there are multiple similar tools, long-click on the pointer tool icon on the pointer tool toolbar to see available options.

Chart trading bar

Use the chevron icon at the bottom right of the chart to open the trading toolbar.

Use horizontal lines on the chart and the arrows above the buy/sell buttons to select a price for trading.

Custom Time Intervals

  • In the time interval drop-down menu on a chart, select Custom....
  • Enter your custom time parameter and click OK.
  • Your custom entry is added to the time interval menu for easy access in the future.

Custom time intervals