Horizontal and vertical line pointer tools (cursors) have been added to the chart. This video will show you the various ways to add and interact with them.
Adding a horizontal line
A pointer tool toolbar has been added to the far right of the app. This is a global toolbar for all charts on the page.
Click on the line icon.
Once the tool is highlighted, clicking on the chart will place a cursor.
When a cursor is selected, three white circles will appear on it.
Use these white circles to drag the line.
Place a horizontal line to select a price in the trading toolbar
When the trading toolbar is open, clicking in the price scale to place a horizontal line will push that price to the trading toolbar.
Global cursors on charts
From the pointer tools toolbar, click the link icon beneath the Cursor pointer tool. This will activate crosshairs on all charts.
Drawing Tools: Trend Lines
Adding a trend line
A pointer tool toolbar has been added to the far right of the app. This is a global toolbar for all charts on the page.
Click on the line icon.
Once the tool is highlighted, click on the chart to place the first point, then click again to place the second point to create a line.
Adding a trend channel
A pointer tool toolbar has been added to the far right of the app. This is a global toolbar for all charts on the page.
Click on the line icon.
Once the tool is highlighted, click on the chart to place the first point, then click again to place the second point to create a line.
The channel line will appear immediately after placing the second point. Move your mouse to create the channel. Click to place the channel.
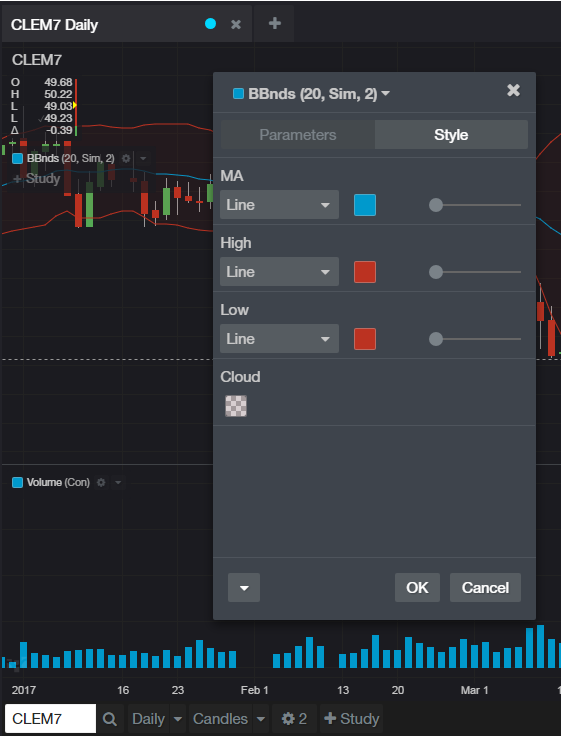
Changing drawing tool and line properties
Whenever a drawing or a drawing tool button in the toolbar is selected, a floating toolbar will appear.
You can drag this toolbar to wherever you'd like. There is one floating palette for the entire app.
Use the buttons on the toolbar to edit the properties of a selected cursor.
Editing and deleting drawing tools and lines
When a drawing is selected, three white circles will appear on it.
Use the white circles to drag the drawing to another location.
Delete a drawing by right-clicking on one of the white circles.
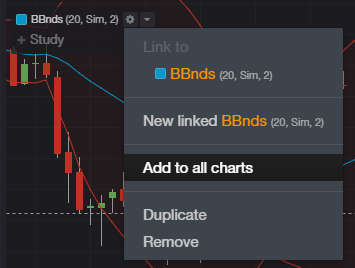
Accessing pointer tools when there are several versions of similar tools
When there are multiple similar tools, long-click on the pointer tool icon on the pointer tool toolbar to see available options.
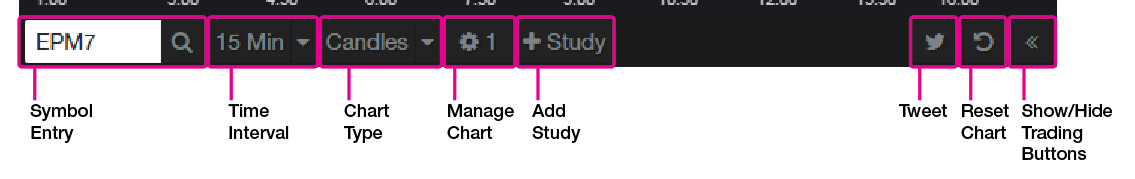
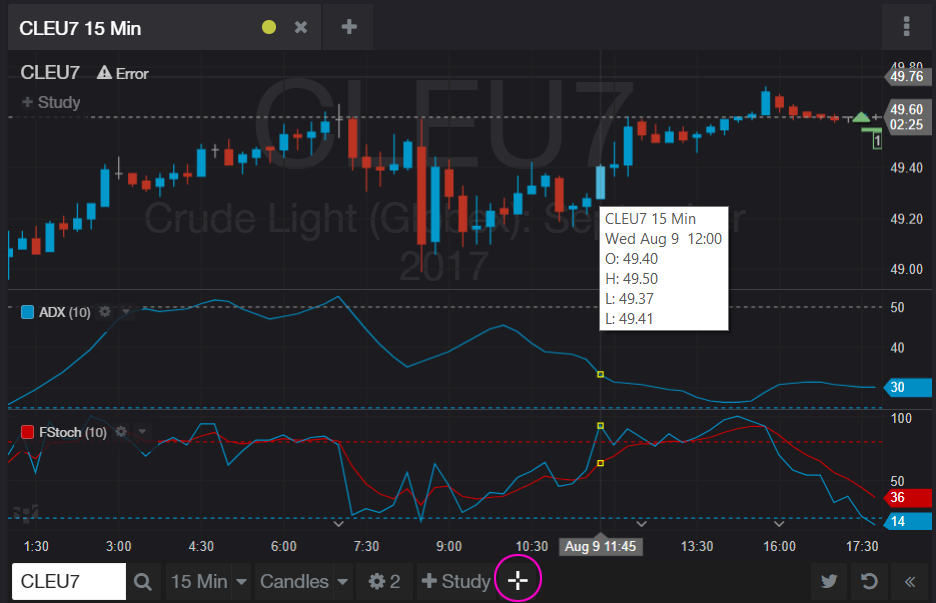
Chart trading bar
Use the chevron icon at the bottom right of the chart to open the trading toolbar.
Use horizontal lines on the chart and the arrows above the buy/sell buttons to select a price for trading.