基本偏好设置
基本偏好设置
更改密码
显示名称
界面偏好设置
语言
主题
买卖颜色
涨跌颜色
显示布局
报价格式
界面偏好设置
语言
主题
买卖颜色
涨跌颜色
显示布局
报价格式
交易
限价与止损单默认设置
高级订单类型默认设置
预埋和激活
混合下单
通知
计价
交易
限价与止损单默认设置
高级订单类型默认设置
预埋和激活
混合下单
通知
计价
Smart Orders Preferences
Enable and configure smart orders, such as Bracket or Iceberg orders.
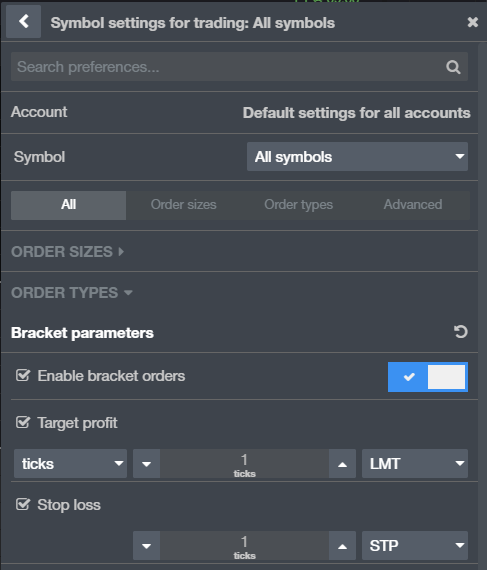
Before setting preferences for all but OCO orders, choose whether the settings should apply to all symbols or a particular symbol. The symbols list is a master list for all smart orders, so that all symbols from each tab are listed there.
Configure Bracket Orders
- In order to place bracket orders, toggle switch must be set to on/blue. Currently this is on by default.
- Clicking the checkbox on the left will enable you to customize bracket order settings.
- Enter a tick, profit value, or price for the target order. You can also select limit, trailing limit, or iceberg order type.
- Enter a tick value for the stop loss order. You can also select stop, stop limit, or trailing stop order type.
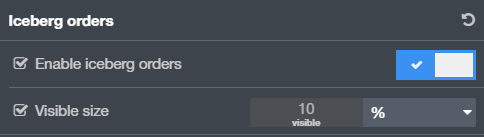
Configure Iceberg Limits
- In order to place Iceberg limit orders, you must select the Enable check box.
- Enter a visible order size. Only this size is displayed on the book.
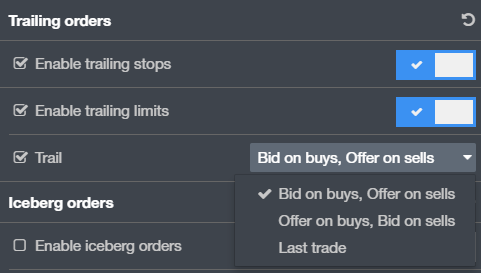
Configure Trailing Orders
- In order to place trailing stop or limit orders, you must select the appropriate Enable check box.
- Choose the behavior for the trailing limit orders by selecting one of the radio buttons.
Smart Orders Preferences
Enable and configure smart orders, such as Bracket or Iceberg orders.
Before setting preferences for all but OCO orders, choose whether the settings should apply to all symbols or a particular symbol. The symbols list is a master list for all smart orders, so that all symbols from each tab are listed there.
Configure Bracket Orders
- In order to place bracket orders, toggle switch must be set to on/blue. Currently this is on by default.
- Clicking the checkbox on the left will enable you to customize bracket order settings.
- Enter a tick, profit value, or price for the target order. You can also select limit, trailing limit, or iceberg order type.
- Enter a tick value for the stop loss order. You can also select stop, stop limit, or trailing stop order type.
Configure Iceberg Limits
- In order to place Iceberg limit orders, you must select the Enable check box.
- Enter a visible order size. Only this size is displayed on the book.
Configure Trailing Orders
- In order to place trailing stop or limit orders, you must select the appropriate Enable check box.
- Choose the behavior for the trailing limit orders by selecting one of the radio buttons.
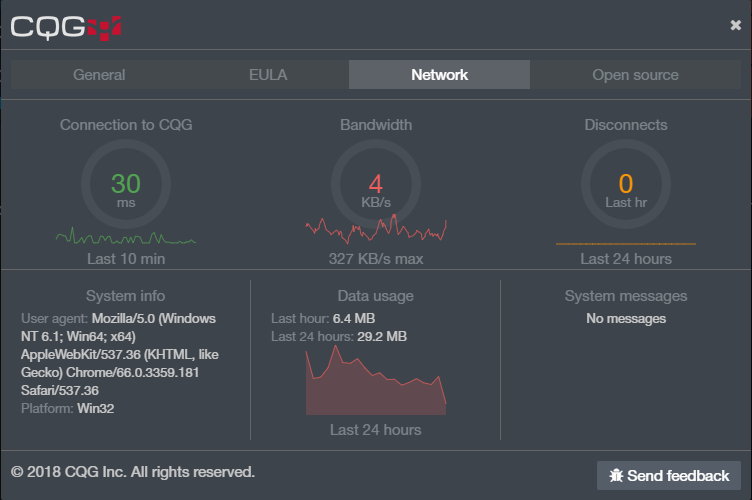
Connection Status
In the lower left bar, the connection status icon shows the general health of your connection to CQG. This is meant to show the general health of the connection to CQG.
- Green: connection is good, the ping to CQG servers is less than 2.5 seconds
- Yellow: connection is not good, the ping to CQG servers is more than 2.5 seconds
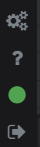
Clicking on the network connection status icon will launch the Network dialog. This dialog gives an overview of your connection and will help with troubleshooting.
- Connection to CQG: ping time to CQG servers. Anything less than 2500 ms is considered good.
- Bandwidth: shows the peak bandwith consumption and current bandwidth consumption.
- Disconnects: shows the number of disconnects in the last hour and 24 hours. 10 or more disconnects in the last hour is not good.
- System info: information about your machine.
- Data usage: amound of data used by CQG Desktop in the last hour and 24 hours.
- System messages: Messages about system outages or planned maintenance.
If you see information here that indicates a bad connection, take a screenshot of the dialog. If you are having issues and need to contact support, you can click on the "Send feedback" button. It will open the send feedback dialog. Attach the screenshot of the dialog to help our technicians diagnose issues.
Connection Status
In the lower left bar, the connection status icon shows the general health of your connection to CQG. This is meant to show the general health of the connection to CQG.
- Green: connection is good, the ping to CQG servers is less than 2.5 seconds
- Yellow: connection is not good, the ping to CQG servers is more than 2.5 seconds
Clicking on the network connection status icon will launch the Network dialog. This dialog gives an overview of your connection and will help with troubleshooting.
- Connection to CQG: ping time to CQG servers. Anything less than 2500 ms is considered good.
- Bandwidth: shows the peak bandwith consumption and current bandwidth consumption.
- Disconnects: shows the number of disconnects in the last hour and 24 hours. 10 or more disconnects in the last hour is not good.
- System info: information about your machine.
- Data usage: amound of data used by CQG Desktop in the last hour and 24 hours.
- System messages: Messages about system outages or planned maintenance.
If you see information here that indicates a bad connection, take a screenshot of the dialog. If you are having issues and need to contact support, you can click on the "Send feedback" button. It will open the send feedback dialog. Attach the screenshot of the dialog to help our technicians diagnose issues.